Observability
GitHub Actions runner observability and monitoring information
WarpBuild collects telemetry data to display metrics and logs for your runners. This page provides information about the observability collection process and port usage.
The Observability page in WarpBuild is organized into two sections:
- Recommendations: View runner instance right-sizing recommendations based on resource utilization patterns.
- Usage: View detailed metrics and logs for individual runner instances.
Recommendations
The Recommendations view helps you optimize your runner configurations by displaying hierarchical performance metrics and identifying resource bottlenecks.
Hierarchical Metrics
Performance metrics are aggregated and displayed in a hierarchical structure:
- Repository: Top-level grouping of all workflows in a repository
- Workflow: Individual workflow files within a repository
- Job: Specific jobs defined in each workflow
- Instance Type: Instance type used for each job
This hierarchy allows you to drill down from high-level repository metrics to specific job and instance type performance data.
Performance Summaries
For each runner instance, the following performance metrics are displayed:
- CPU Utilization: Maximum rolling average CPU usage percentage over last 30s
- Memory Utilization: Maximum memory usage percentage
- Filesystem Utilization: Maximum storage usage percentage
- Disk I/O: Maximum rolling average of read+write disk throughput over last 30s
- Network Utilization: Maximum rolling average of read+write network throughput over last 30s
Resource Threshold Alerts
The Recommendations view can filter and highlight instances that violate predefined resource thresholds. This helps you quickly identify runners that are under-provisioned (that have consistently high resource utilization) or over-provisioned (that have low resource utilization).
Thresholds for the under-provisioned recommendation:
| Metric | Threshold | Alert Label |
|---|---|---|
| Max Sustained CPU | >= 80% | High CPU Usage |
| Max Memory Utilization | >= 80% | High Memory Usage |
| Max Filesystem Utilization | >= 80% | High Filesystem Usage |
| Max Disk I/O | >= 80% of supported throughput | High Disk IO |
Use these insights to right-size your runner instance configurations for optimal cost and performance.
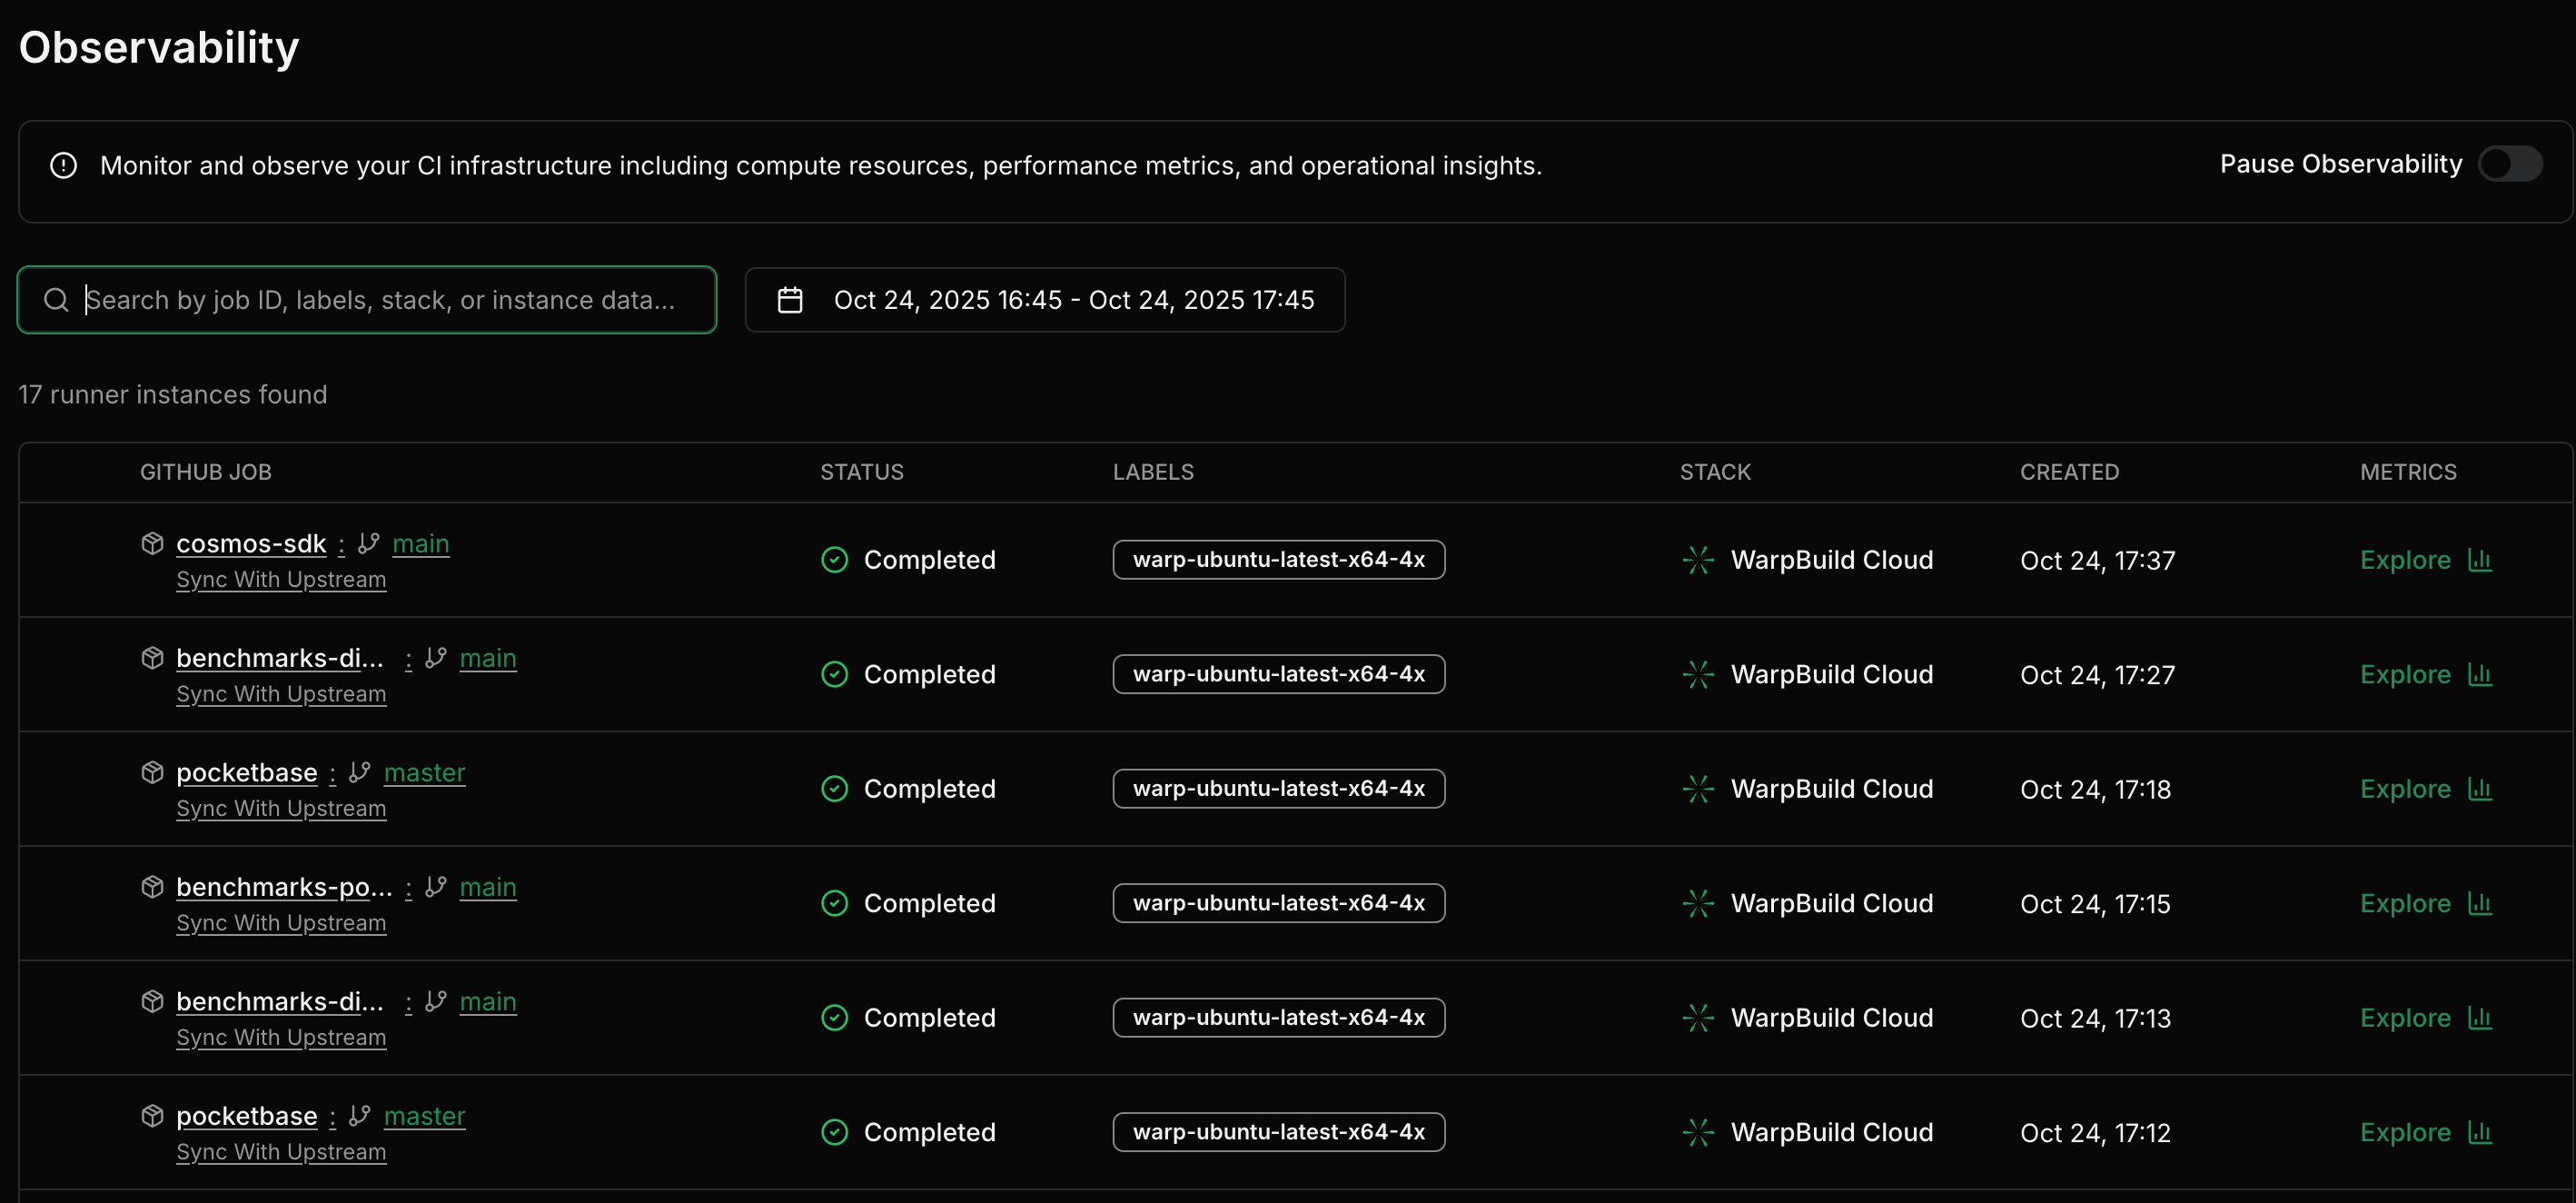
Usage
The Usage view provides detailed observability data for individual runner instances, including metrics and logs.
Observability Collection
WarpBuild agents running on your runners collect the following observability data:
- CPU, memory, filesystem, and network utilization metrics. This helps with understanding resource bottlenecks on the runner.
- System logs for capturing WarpBuild and other service behaviors, useful for debugging runner issues.
- GitHub Actions logs to help correlate workflow execution with system metrics and logs in the UI.
The collected logs and metrics can be viewed in the WarpBuild UI's Observability page.
Pausing Observability
Observability data collection can be paused. When paused, no telemetry data is collected from your runners, including system logs, and GitHub Actions logs.
For pooled instances, you may see observability data appear in the UI before a job is allocated to the instance. This is expected behavior when data collection is paused - the telemetry agent initializes but no actual data is collected until job allocation.
 The chart displays info about the resource utilization on your runner instance.
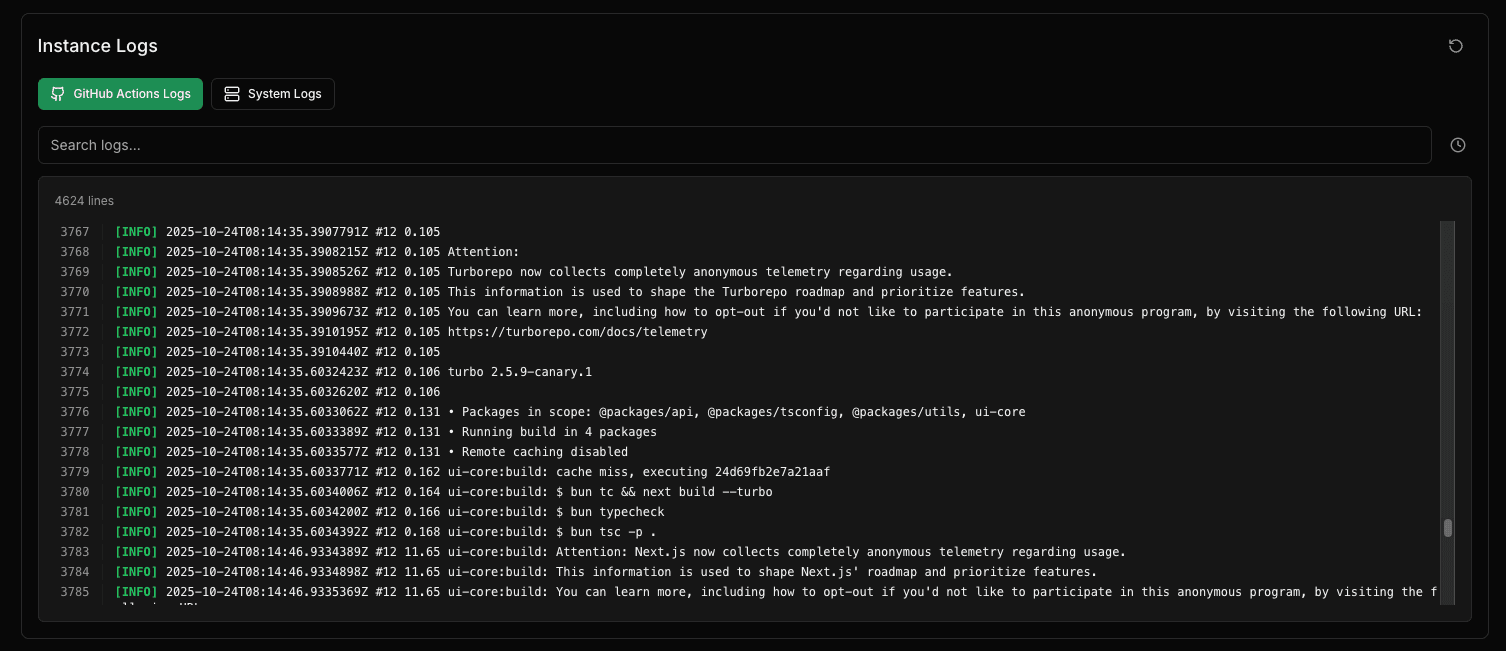
The logs view shows both system logs (syslogs) from your runner and GitHub Actions logs, making it easier to correlate workflow execution with system behavior.
Observability only collects metrics and logs for jobs that are longer than ~1 minute.
Port Usage
WarpBuild observability uses port 33931 for data collection and communication with the WarpBuild platform and uses OpenTelemetry for data collection.
Data Privacy
WarpBuild observability collection follows our privacy and security policies:
- No sensitive data is collected through telemetry. We only collect syslogs and utilization metrics of the runner like CPU, memory, filesystem and network.
- All observability data is encrypted in transit.
- No data is used for training or any other purpose beyond providing observability insights for your runners.
If you have any queries regarding the observability, please reach out at [email protected].
Last updated on